How to Graph data in PostgreSQL
I've always considered statistical analysis a dry subject, that is
until I had to make sense of my syslog. I wasn't too keen when I first
started out on the task because of the sheer numbers involved, several
hundred thousand lines of logged messages to be precise. Since there's
more than one way to interpret numbers I decided that the best way to
organize the information was to process it through a database and
generate graphs for a number of different relationships.
This article shows how to data mine a Unix based server's syslogs
using PostgreSQL's implementation of R (pl/r).
Here's what you need to know to walk through the steps of gathering
data and generating relevant statistics:
- A working syslog daemon
- A working firewall configured to log activities into the syslog
daemon
- R, the high level statistical programming language (version 1.7.1 or higher)
- The PostgreSQL RDBMS, http://postgresql.org
(this article was based upon PostgreSQL 7.4RC2)
- The latest plr source code, http://www.joeconway.com/plr/
, (current snapshot is plr-0.5.4-alpha)
These are the rights and privileges that you'll need:
- Superuser privileges for your machine
- Superuser privileges for your PostgreSQL server
- Be able to install binaries and compile source code
- Be able to stop and start services
You'll require a basic knowledge of SQL, functions and procedural
languages in PostgreSQL. R is covered only enough to get you up and
running.
The Challenge
The objective is to collect, collate and analyze the firewall
activity from one machine using graphs. This server is assumed to be
using a Linux based distribution (Debian) and the default shell is
bash. The firewall is iptables. The R data analysis and graphics
language is version 1.8.1 (build 2003-11-21). The PostgreSQL server is
version 7.4RC2 using the PL/R procedural language binding for R
(version plr-0.5.4-alpha).
About R and PL/R
R is the fast food of graphical development packages. It is a
fantastically powerful interpretive
language. It's been designed for finding patterns among large gobs of
numbers, that's what statistical analysis is all about. There's a lot
of overlap between what Postgres can do with numbers and that of R.
Gathering the Tools
The R language can be installed using Debian's advanced package tool
using the command:
apt-get install R
You can download the source code from the Debian site using the
following command line instruction:
apt-get source postgresql
The PostgreSQL source code is also available as a tar ball and deb
and rpm packages. It can be downloaded from http://postgres.org.
Preparing the PostgreSQL server
Compiling the pl/r module requires the
Postgres source code. Further instructions are available at http://www.joeconway.com/plr/.
Compile the pl/r module and then install it into the Postgres library
directory, which is normally /usr/local/pgsql/lib. You need
to set the environment variable R_HOME
(refer to the plr
documentation).
Preparing the Database
The psql client was used to invoke these SQL commands to define
the firewall table:
CREATE DATABASE firewall;
CREATE TABLE master (hit text);
CREATE TABLE firewall (
d_stamp time stamp,
source_ip inet,
protocol varchar(4),
src_port int,
dest_port int
);
The pl/pgsql language is now installed by using:
createlang -d firewall -U postgres
plpgsql
The pl/r language is installed using these SQL commands:
[ed: See also contrib/plr/plr.sql to define plr]
CREATE FUNCTION plr_call_handler()
RETURNS LANGUAGE_HANDLER
AS '$libdir/plr' LANGUAGE C;
CREATE LANGUAGE plr HANDLER
plr_call_handler;
Verify the correct installation of the language:
$~ createlang -l -d firewall -U postgres;
The Postgres server startup script is edited to include the
path to the R package using the environment variable R_HOME. For
example, this is what I use on my machines in the postgresql server
script located in /etc/init.d/:
export R_HOME=/usr/lib/R
A final test is made by running the following function:
- CREATE OR REPLACE FUNCTION
myecho(text) returns text as '
print(arg1)
' language 'plr'
A quick and dirty Introduction to R
Open a terminal console and invoke the R language by typing 'R'. You
should get a '>' prompt. Now type the following:
> x <- 1:10
> y <- 1+x+rnorm(10,0,1)
You've just created two vectors. There are 10 variables 'x' vector
numbering from 1 to 10. The y variable has a set of ten vectors where
each variable is the solution of the equation '1+x+rnorm(10,0,1)' and
rnorm is a statistical function.
Typing this next line will plot x vs y on a graph:
> plot(x,y)
- Different kinds of graphs can be generated by changing the
parameters:
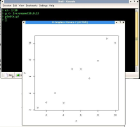
screenshot1.jpg
>plot(x,y) |
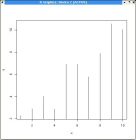
screenshot2.jpg
>plot(x,y,type="h")
|
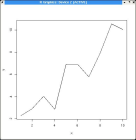
screenshot3.jpg
>plot(x,y,type="l")
|
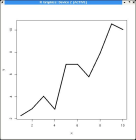
screenshot4.jpg
>plot(x,y,type="l",lwd=3) |
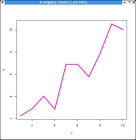
screenshot5.jpg
>plot(x,y,type="l",lwd=3,col=6)
|
|
- > postscript("myplot.ps")
- > plot(x,y)
- > dev.off()
- Here are a number of other formats that the graphs can be saved
to
- > postscript("myplot.ps")
- > plot(x,y)
- > dev.off()
|
- >png("myplot.png")
- >plot(x,y)
- >dev.off()
|
- >pdf("myplot.pdf")
- >plot(x,y)
- >dev.off()
|
The graphics device is turned off by using the dev.off function.
Making Graphs Using PL/R
Graphs can be as easy as '123'. Here's an example where two columns
in a table are plotted against each other.
Create and populate the table using the following commands:
- CREATE TABLE temp (x int, y int);
- INSERT INTO temp VALUES(4,6);
- INSERT INTO temp VALUES(8,3);
- INSERT INTO temp VALUES(4,7);
- INSERT INTO temp VALUES(1,5);
- INSERT INTO temp VALUES(7,8);
- INSERT INTO temp VALUES(2,3);
- INSERT INTO temp VALUES(5,1);
- INSERT INTO temp VALUES(9,4);
The function f_graph()
generates the graph as a pdf document:
- CREATE OR REPLACE FUNCTION
f_graph() RETURNS text AS
'
- str <<- pg.spi.exec
(''select x as "my a" ,y as
"my b" from temp order by x,y'');
- pdf(''/tmp/myplot.pdf'');
- plot(str,type="l",main="Graphics
Demonstration",sub="Line Graph");
- dev.off();
- print(''done'');
- '
LANGUAGE plr;
- Creating the graph by invoking this query:
SELECT f_graph(); 
Preparing the Firewall data source
Make sure that your firewall rules have a line instructing all messages
are to be logged. This iptables command for example will record all
messages to the syslog:
#/sbin/iptables -A INPUT -p all -s 0/0 -j LOG
I used zcat, grep and sed to process the
message logs prior to uploading the data into the database.
Uploading the Firewall Data
Getting the desired data from the syslog into the database is a two
stage process: the first step is to upload the desired data in its raw
form to the table master. The second step is to export only the
desired fields into the table firewall.
Step 1
This screen shot shows an example of commands that parse and then
uploads the data into the database. The objective here was to filter
out what I didn't want, in my case only those messages that came from
the firewall and didn't include the ip address 224.0.0.1.

Step 2
Here is a typical record from the master table:
Feb 6 07:40:27 SRC=200.242.204.8
DST=64.230.28.216 LEN=78 TOS=0x00
PREC=0x00 TTL=105 ID=52727 PROTO=UDP SPT=1027 DPT=137 LEN=58
Each line is a complete log
that needs to be broken down further into individual fields before it
can be copied into the table firewall. A time stamp will be generated
for each record.
Two user-defined functions are used in this script:
- f_firewall(): Identifies
the first 16 characters of each line as a date
stamp.
- f_parse(text,text): This
function takes two parameters, the string to be converted as a time
stamp and the rest of the record. The function parses out the required
named pair variables casting them into the correct data-type into the firewall
table.
The invocation that copies the desired information from master
to firewall is:
SELECT f_firewall();
Graphing the Firewall Hits
- It's simply amazing the things that you can learn when data is
presented in a graphical format. For example, I had no idea prior to
writing this article that such a small number of ip addresses was
responsible for the vast majority of probes to my server, refer to
graph 2. And even more surprising was that most probes were taking
place at 10am every morning, refer to graph 3!

Graph 1: Number of hits by protocol.
Here's the src.
|

Graph 2: Top 30 ip address Offenders.
Here's the src.
|

Graph 3: Accumulated Number of hits in a 24 hour period.
Here's the src. |
Caveats
Remember that PL/R is young and is undergoing constant development.
Try avoiding running
complex SQL queries from a plr based function. Instead, run them in a
plpgsql function.
PL/R is an untrusted language so it can do anything on the server
with the same permissions of the PostgreSQL process. Beware! This
includes such dangerous actions as erasing the database cluster.
Conclusion
Joe Conway has done a great job porting R to the PostgreSQL
environment. Frankly, I don't think I've done justice in showing the
neat ways
you can create graphs with PL/R. Read the R documentation and you'll
fall in love with this language like I did.
References:


